The yield of ten-year US Treasury Notes has surged by 34 basis points since the middle of October as market participants started adopting a more upbeat outlook on the economy and shied away from safe-haven assets.
Unsurprisingly, the following comes from the minutes of the meeting of November 4 of the Treasury Borrowing Advisory Committee of the Securities Industry and Financial Markets Association:
Several members noted the graph discussing net fixed income supply in 2009 and 2010, and how issuance will ramp up dramatically in 2010. Federal Reserve purchases have taken an enormous amount of supply out of the market this past year across fixed income markets, but next year, financial markets should expect even greater issuance with no support. Such an outcome could pressure rates.
With quantitative easing set to expire during Q1, it is difficult not to see long-term rates rising, unless the economy falls back into the morass.
Turning to technical analysis, the chart below (click to enlarge) shows monthly data for the ten-year Treasury Note yield since 1998 and conveys an important message when considering the two momentum-type oscillators at the bottom (ROC and MACD). The ROC has just reversed course (crossing the zero line) for the first time since a buy signal was given at the beginning of 2007 and now indicates a primary sell signal. The MACD provided a similar indication six months ago.
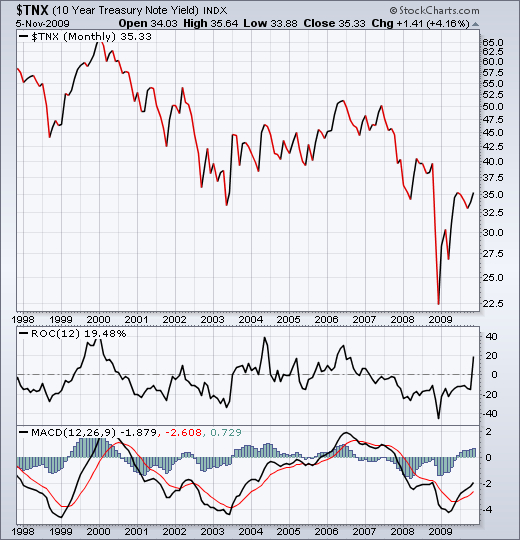
Source: StockCharts.com
(from seekingalpha.com, November 6, 2009)


No comments:
Post a Comment