
Wednesday, November 11, 2009
market outperformance of U.S. exporters
graph of the recent stock market outperformance of U.S. exporters from Bloomberg


IMF: Dollar Carry-Trade Creating Bubbles Around The World
The International Monetary Fund (IMF) highlighted the fact that low interest rates in the U.S., plus an apparent "one-way" bet against the dollar has created a global dollar carry-trade that is driving capital flows into emerging markets.
(from budfox, November 9, 2009)
If not handled properly, this will lead to emerging market asset bubbles, which arguably have already begun to inflate.
We've highlighted before how places like Hong Kong are seeing property prices go through the roof due to low U.S. interest rates.
The fact that the IMF is increasingly vocal on the subject suggests that this process is really starting to become quite substantial phenomenon in many countries.
IMF: There are indications that the U.S. dollar is now serving as the funding currency for carry trades. These trades may be contributing to upward pressure on the euro and some emerging economy currencies. Emerging economy authorities have been responding to capital inflows by accumulating reserves, and, in some cases, with capital controls and other measures, to slow the pace of appreciation. Capital flows driven by yield differentials are complicating monetary policy responses in those economies where there may be a need to tighten—particularly in Asia.
...
Some emerging economies may need to absorb capital inflows and at the same time avoid compromising domestic financial and price stability. With interest rates in advanced economies set to remain low for an extended period, and emerging economies poised to recover at a faster pace, the recent flow of capital into these economies may continue.
Read IMF's recent report(from budfox, November 9, 2009)
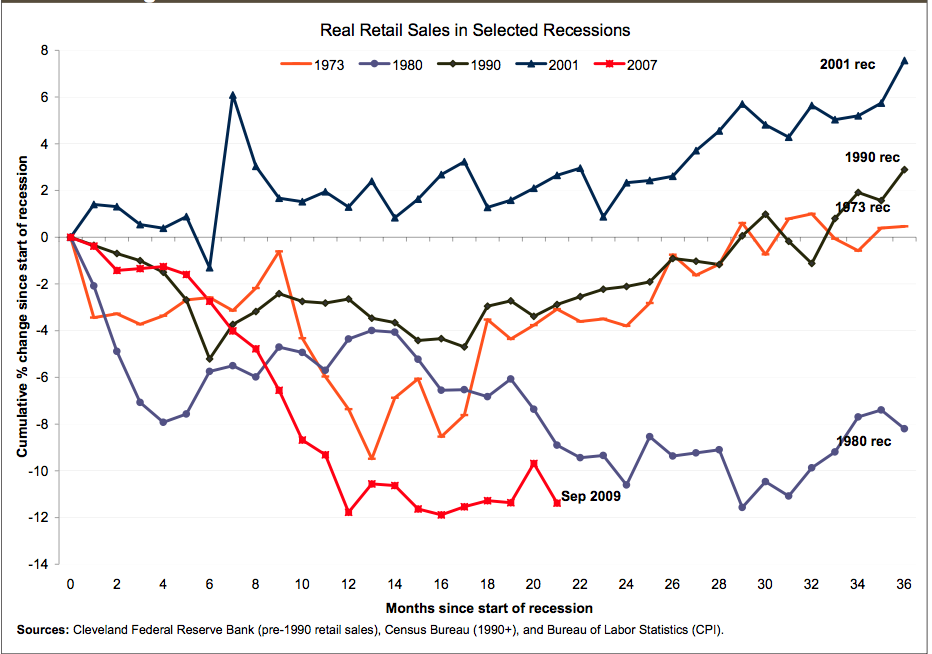
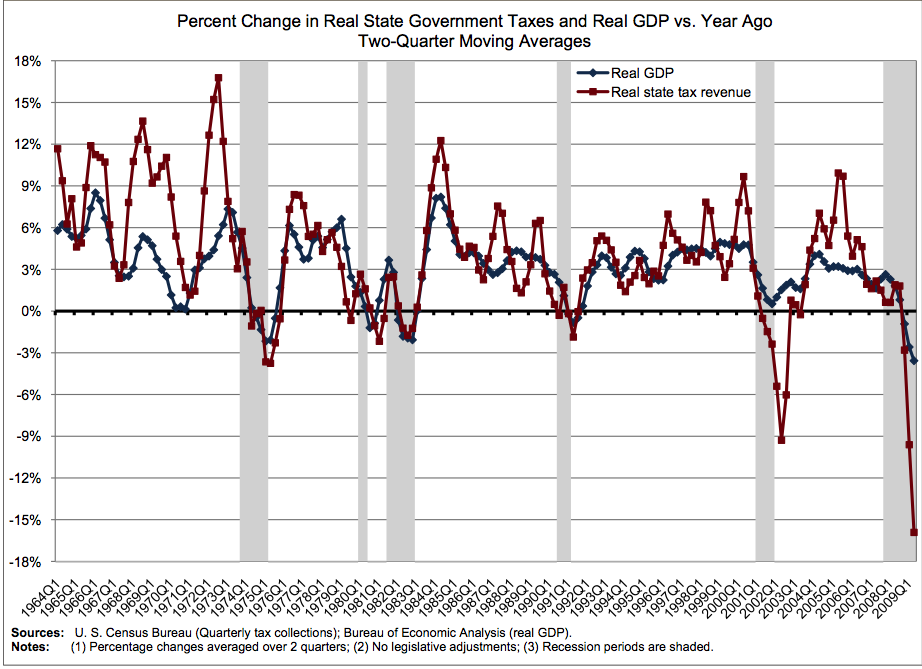
Retail Sales and State Tax Revenues
Retail Sales: 5 Recessions
State Tax Revenues (1964- 2009)
>
Source:
State Tax Revenues Show Record Drop, For Second Consecutive Quarter
Lucy Dadayan and Donald J. Boyd
The Nelson A. Rockefeller Institute of Government
http://www.rockinst.org/pdf/government_finance/state_revenue_report/2009-10-15-SRR_77.pdf
Tuesday, November 10, 2009
closing 2009: sentiments and markets
The two columns below compare several, mainstream news stories from March-April 2009 to those of today:
| Spring 2009: "Dow 5,000? A Bearish Possibility?" (Wall Street Journal) "The bear market is tightening its grip. No one is taking a back seat approach. Everyone is selling. We're collapsing in on ourselves." (New York Times) "I don't want to sound like the grim reaper, but it's possible that one of the [major] averages could come down by another 50% drop from here. This is a slow-drip, slow-death decline." (LA Times) "It's going to continue its easiest path, and that path it sees is down. That's where we're stuck right now and who's going to get out in front of it?" (AP) | November 2009: "Government Policies saved the big banks from imploding..." (Forbes) "We have a lot of room to run. The advance [in stocks] shows that the recession is over. I don't know how you could wish for better circumstances." (Bloomberg) "Dow Above 10,000: The milestone caps a stunning 53% comeback for the Dow since early March. It's almost like an announcement that the bear market is over." (AP) "Today's market rose in spite of the unemployment numbers. It's a sign that the Bull Market Is Back." (CNBC) |
Eight months ago, there was no "fundamental-based" reason to believe the ongoing slaughter of stocks and financials would stop. The U.S. equity market stood at its lowest level in 12 years, while the banking system seemed near a total collapse. In the words of the stories in the left-hand column above -- the bear was "tightening" its grip, the clearest path for stocks was "down," and there was no light at the end of the tunnel.
But as the quotes in the right-hand column show, the opposite actually occurred: A 50%-plus rally in stocks and all-out rebound in investor optimism. This alternative is exactly what our analysts foresaw.
Here, the following archive of EWI's past analysis stands in complete contrast to the "grim-reaper" sounding mainstream:
February 23, 2009 Short Term Update:
"If one is aggressively bearish the stock market, having a planned out exit strategy now is not only prudent, but necessary in light of some of the sentiment readings we see."
Namely, a 3% reading in the Daily Sentiment Index, the lowest level in the 22-year history of weekly figures.
February 23 Elliott Wave Theorist:
"Ideally, the S&P should continue down into the 600's. When it's finds a bottom and rallies, it will be sharp and scary for anyone who is short. I would rather be early than later."
February 27 Short Term Update:
"The turn will come on or near March 10, 2009. Anywhere in this period may mark a turn, which will obviously be a market low."
The S&P bottomed two weeks later at 666.79 on March 9.
April 2009 Elliott Wave Theorist:
The rally "could carry the Dow as high as 10,000. Regardless of its extent, it should regenerate substantial feelings of optimism... the government will be taking credit for successfully bailing out the economy, and investors will be convinced that the bear market is behind us. Be prepared for this environment."
Flash ahead to today: The November 6, 2009 Short Term Update picks up where the April Theorist left off and presents the following close-up of the S&P SPDR Trust versus the 10-day Daily Sentiment Index.

(from elliottwave.com, November 9, 2009)
Monday, November 9, 2009
Indicators Flashing 'Sell' for Longer-Term Bonds
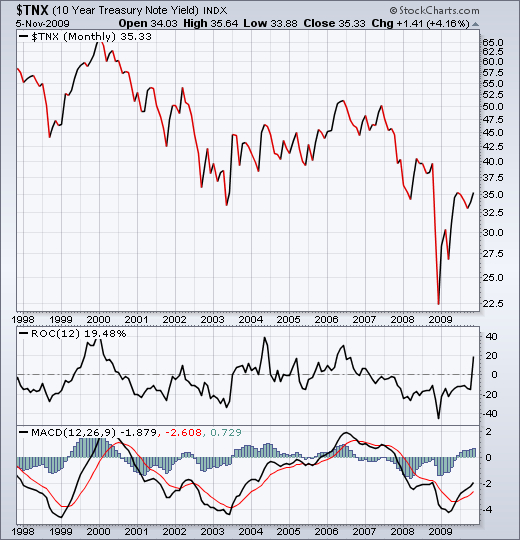
The yield of ten-year US Treasury Notes has surged by 34 basis points since the middle of October as market participants started adopting a more upbeat outlook on the economy and shied away from safe-haven assets.
Unsurprisingly, the following comes from the minutes of the meeting of November 4 of the Treasury Borrowing Advisory Committee of the Securities Industry and Financial Markets Association:
Several members noted the graph discussing net fixed income supply in 2009 and 2010, and how issuance will ramp up dramatically in 2010. Federal Reserve purchases have taken an enormous amount of supply out of the market this past year across fixed income markets, but next year, financial markets should expect even greater issuance with no support. Such an outcome could pressure rates.
With quantitative easing set to expire during Q1, it is difficult not to see long-term rates rising, unless the economy falls back into the morass.
Turning to technical analysis, the chart below (click to enlarge) shows monthly data for the ten-year Treasury Note yield since 1998 and conveys an important message when considering the two momentum-type oscillators at the bottom (ROC and MACD). The ROC has just reversed course (crossing the zero line) for the first time since a buy signal was given at the beginning of 2007 and now indicates a primary sell signal. The MACD provided a similar indication six months ago.
Source: StockCharts.com
(from seekingalpha.com, November 6, 2009)
Subscribe to:
Posts (Atom)

 Posts
Posts


